Anyone who repeatedly accuses Berkeley Earth, NOAA etc. of using 'fake' data is a bad person. Period.
Eli the American Pit Bull Terrier is a bad person.


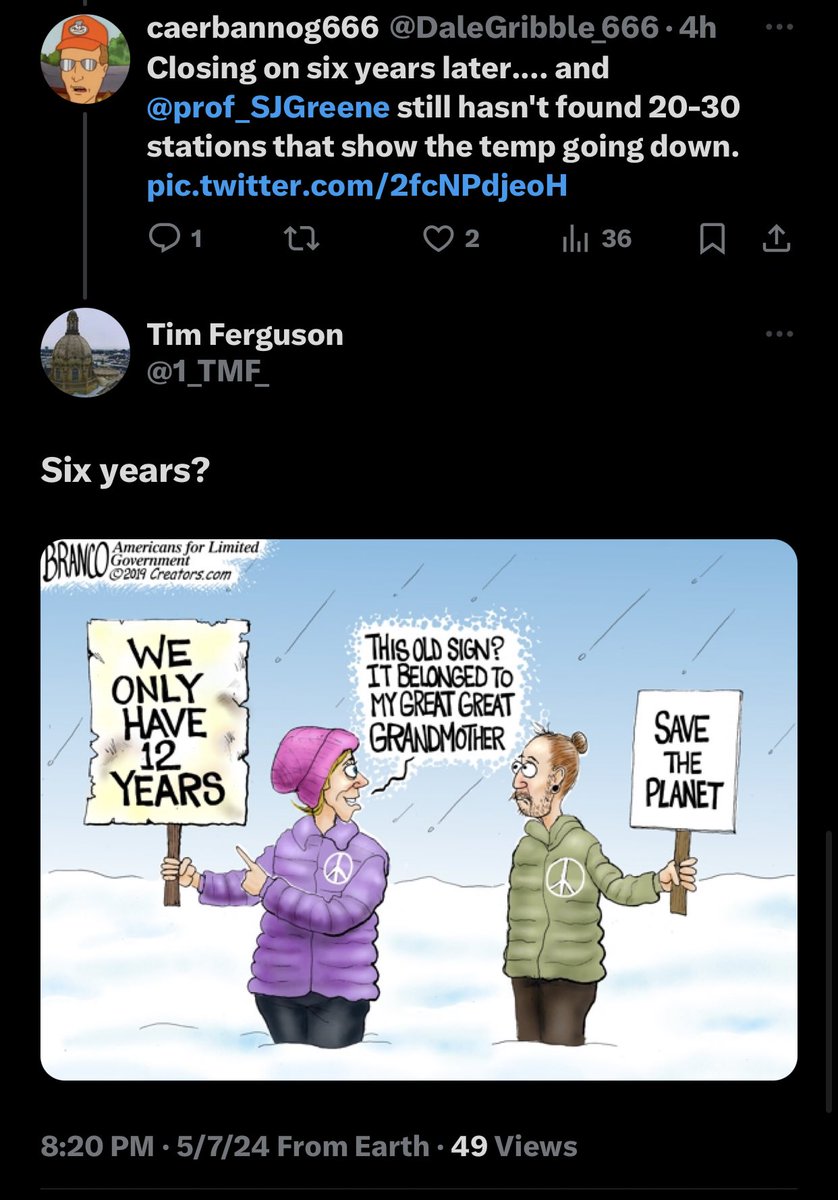
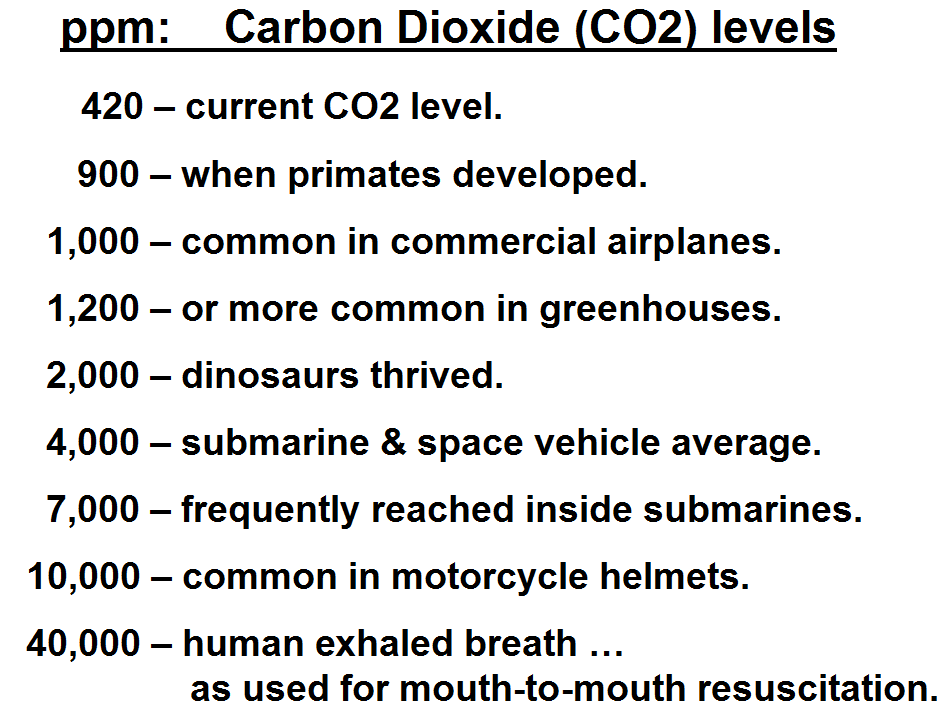
Craig Thomler Neil Roger Spencer 𝔻𝕒𝕨𝕟𝕋𝕁𝟡𝟘™ 🇵🇭💖🇨🇦 Climate of Dawn Austin de^mol @[email protected]🌎 Filipovic@regimechangebc Bobdad Bruno watt smith 🆘️ TR American Savage Chris Contrarian Mumma Bobby Rodermund Mike Jagger Mark Lunn Friends of Science 💧David Young Rogue35F Brandon Daly ❄️ caerbannog666 🇺🇸🇺🇸🏴☠️🏴☠️💉💉💉💉 Attack and Dethrone the South La Bourgeoisie Brin Haerycammel Pancho Neptune Andrea Jimmy (∅) Jim (∅) Jim (∅) Jim Donald Trump is the legitimate President Jim Java ꤶ @[email protected] Will Helen O'Driscoll SoulPower Dr. Waheed Uddin Michigan-Canadian Front AltUSARC Torbjörn Pettersson Lyle Robinson Ned Nikolov, Ph.D. President-Elect Erin MacDonald Science Resists George Pembroke Kev كيفين Pluck 🇵🇸🇺🇦 Dave Stewart Halil Sen 艾米莉 LIES! CO2 has been MUCH HIGHER! in fact we are at DANGEROUS LOWS! YOU'RE A SCAMMER DUDE!

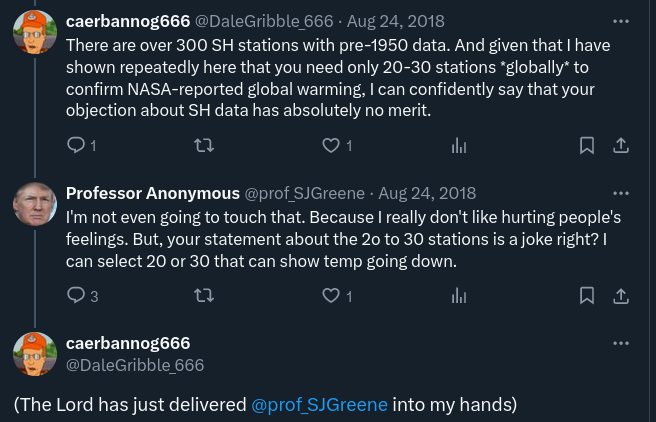
Professor Anonymous caerbannog666 🇺🇸🇺🇸🏴☠️🏴☠️💉💉💉💉 Geoffrey Stevenson John Mauer brad schrag StormSignal La Bourgeoisie ClimateCatastrophist Fraser MacLeod🇨🇦🇵🇸 Almops Craig Thomler Brandon R. Gates Roger Spencer Mervyn Sullivan Pure Skeptic Vincent Philion Bruce J Juhl Tim Ferguson Jack Eddyfier James Polov MichaelCrow Life Warrior nosegoblin 🇦🇺 President Canberroo 🇦🇺 Mike Jagger tjtjgeol President Weevil, Tanuki City / Graeber Crow / Wallace Westland 🇳🇿 Dan Satterfield Ned Nikolov, Ph.D. Geoff Price Camburn Shephard Daniel Inventor Lee Wheelbarger Eli Rabett Atomsk's Sanakan Rog Tallbloke (Righto/Chief) 🇬🇧 Ike Kiefer Ceist 🇺🇦🇺🇦Dr Elisabeth Kosters is on BlueSky🇨🇦🇳🇱 Closing on six years later.... and Professor Anonymous still hasn't found 20-30 stations that show the temp going down.

Jim D Ken P. BubbasPossumRanch Kenneth Richard Ben Koby nonsequiturmemes Eli Rabett Lex Joe Public PushFourLeft Mike Leiter Craig Thomler Ecological Spirit RixAutomatedMat Jim Bowers George Jefferson TrixX306 Dr. Brian Poe Chris B Bacon James Abbott 🇺🇦 Rosie Jim Java ꤶ @[email protected] Mark Lunn complotwapextraordinaire Chow for now La Bourgeoisie Wayne Allan Joseph Gatta Indonesisches Bergwiesel MichaelCrow Roger Clague John Crowley Martin - Vax’ed and Boosted Bob Partridge annamaypiday Noel John Turner TruthWillNeverDie Christopher Collins Jim Gorman Ace of Based benjamin Marek Sas-Kulczycki George Harrison Joseph E Postma SortingThruDaNoiz de^mol Anderoo Josson Me myself and I Nick Schroeder Toshiaki Asahi Also saw this in the Shewchuk thread where I got his lecture schedule.
Seems totally on-brand.


BONUS Natalie Carmody Craig Thomler The individual who posts as Natalie Carmody is indeed a shameless pathological liar.
Here is just one of many examples that proves that.

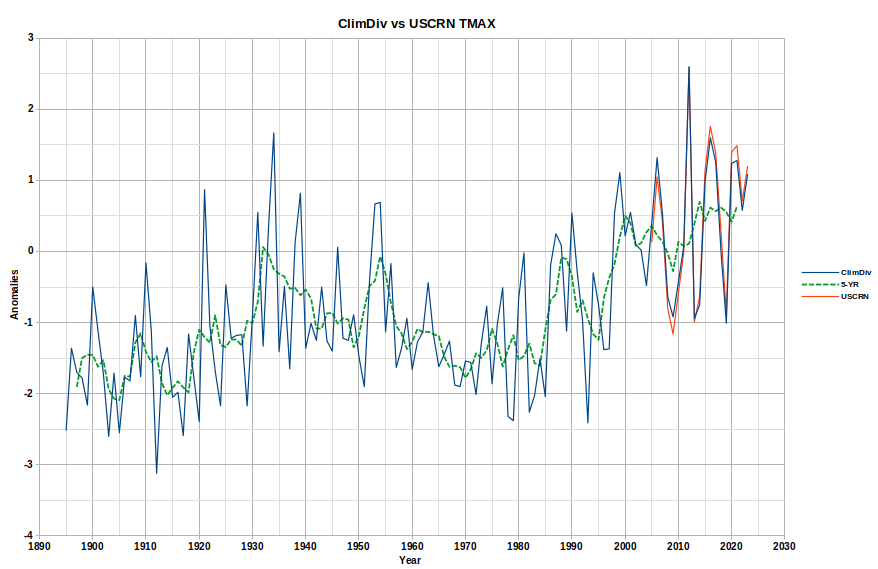
Jim Java ꤶ @[email protected] John Dodders Also: my own USHCN raw TMax vs. Heller's.
Why oh why does my USHCN raw TMax look so different from Heller's post-2000, (where his temps ramp down but mine don't)?
I'm completely lost at sea here. What am I doing wrong?
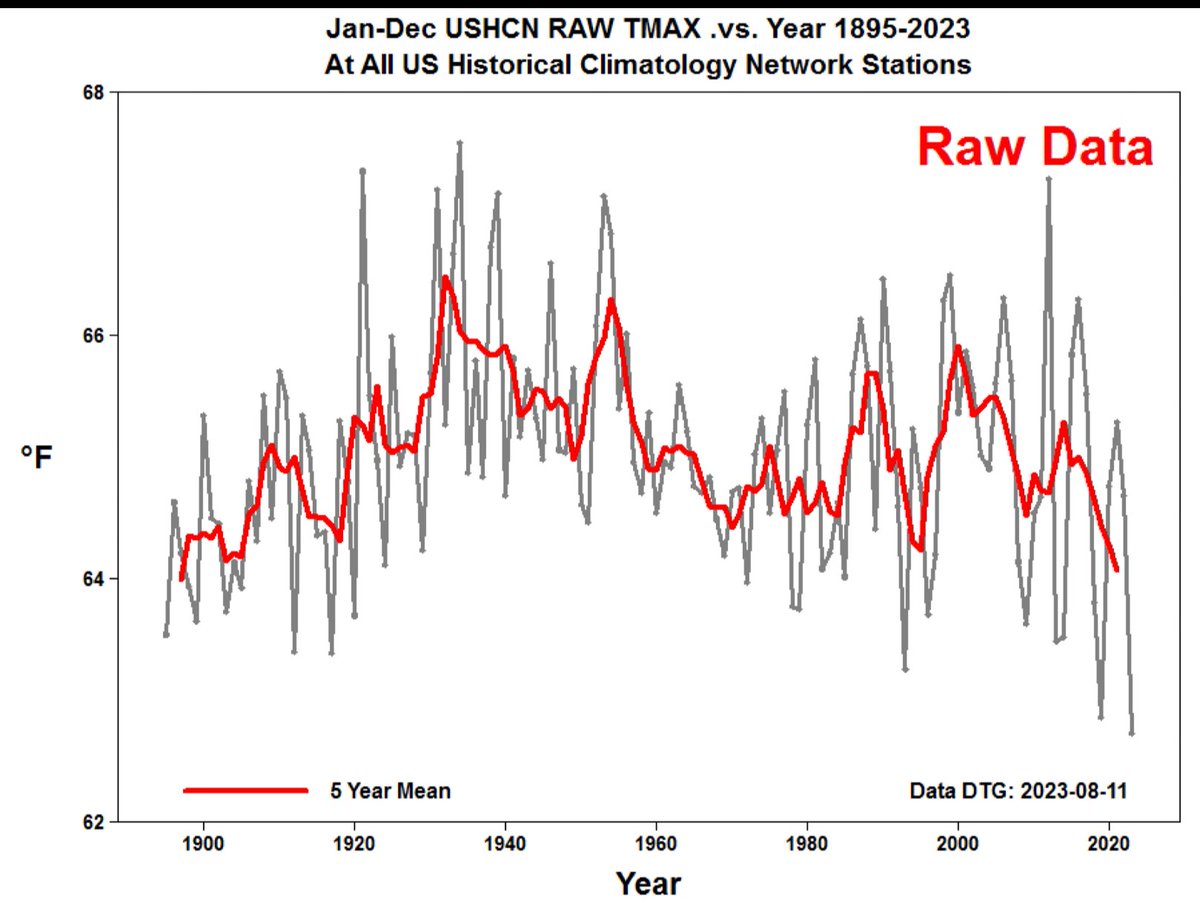

Jim Java ꤶ @[email protected] John Dodders This chatter about USCRN etc. got me looking at Heller USHCN results.
I plotted up ClimDiv & USCRN (1&5yr avg) TMax. Then compared w/Heller raw USHCN TMax.
If Heller's right, shouldn't his post-2005 raw results line up more closely w/pristine rural USCRN?
I'm very confused.

Jim D Ken P. BubbasPossumRanch Kenneth Richard Ben Koby nonsequiturmemes Eli Rabett Lex Joe Public PushFourLeft Mike Leiter Craig Thomler Ecological Spirit RixAutomatedMat Jim Bowers George Jefferson TrixX306 Dr. Brian Poe Chris B Bacon James Abbott 🇺🇦 Rosie Jim Java ꤶ @[email protected] Mark Lunn complotwapextraordinaire Chow for now La Bourgeoisie Wayne Allan Joseph Gatta Indonesisches Bergwiesel MichaelCrow Roger Clague John Crowley Martin - Vax’ed and Boosted Bob Partridge annamaypiday Noel John Turner TruthWillNeverDie Christopher Collins Jim Gorman Ace of Based benjamin Marek Sas-Kulczycki George Harrison Joseph E Postma SortingThruDaNoiz de^mol Anderoo Josson Me myself and I Nick Schroeder Toshiaki Asahi Folks, if you happen to be in The Villages (Florida) in the near future, don’t forget to miss the next Shewchuck lecture.
Even better, don’t forget to miss them all.
Still better, just stay away from The Villages in the first place.

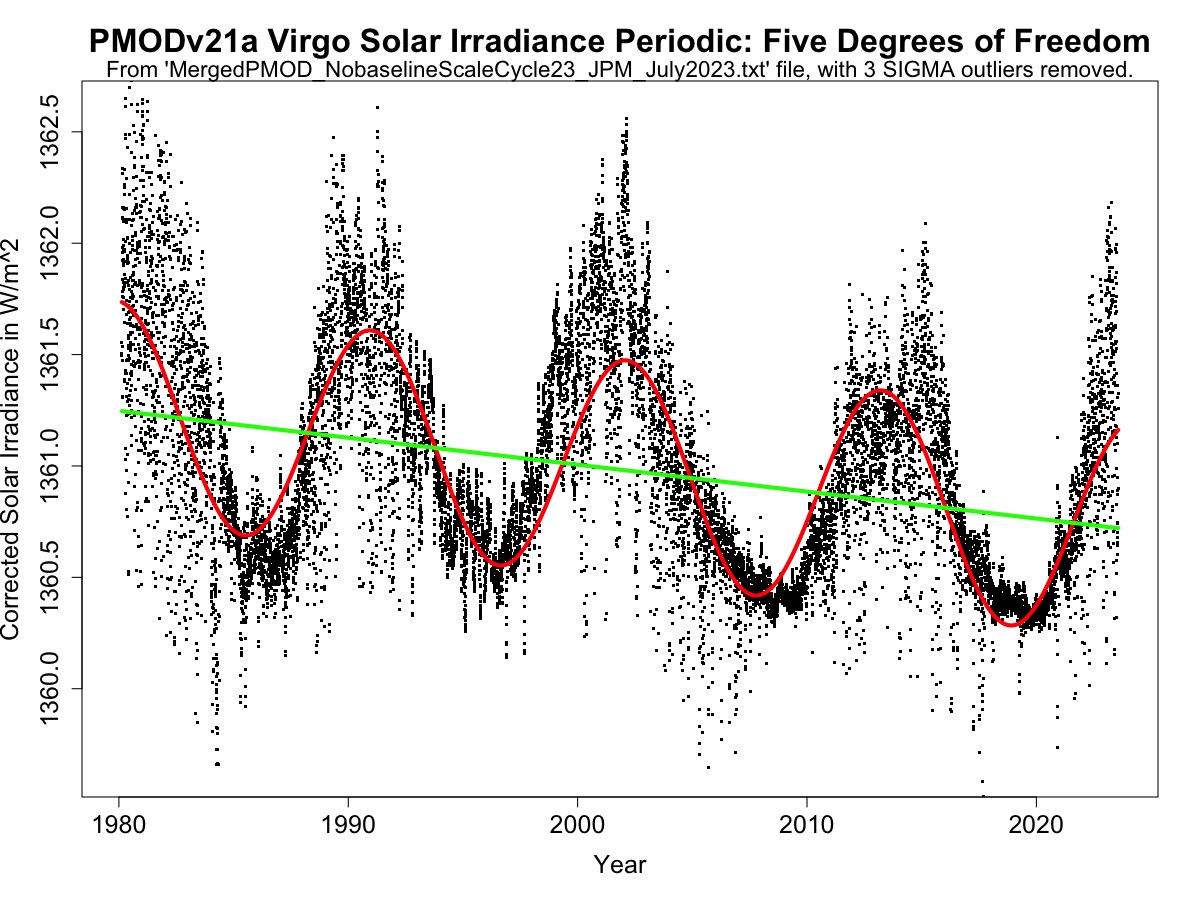
James William Owens @fcmfcs2019 FactChecker76 Mervyn benjamin Jim Java ꤶ @[email protected] Jim Gorman MRAF Kenneth Richard Sharon Patterson Aanthanur That Was Then This Is Now 🇺🇸 🎬☣️Spurgly Donald☣️🎬 Bourgeois Bolshevik 🇦🇺 steven mosher #bitcoin Reinhard Kuhn Over400ppm bart Mystick Theater Claude 🇭🇹🇩🇪🇺🇸🇫🇷🇮🇱 Boothe 𝔻𝕒𝕨𝕟𝕋𝕁𝟡𝟘™ 🇵🇭💖🇨🇦 Climate of Dawn Jim Fisher Rodger L Nelson @RushhourP #AaronBushnell #RefaatAlareer #RachelCorrie caerbannog666 🇺🇸🇺🇸🏴☠️🏴☠️💉💉💉💉 Setophaga Calvin (Zod ) Lord King Frederik BubbasPossumRanch Jim D Friends of Science Winder 🚩💜Dave Dent #SmashtheWEF Will Huygens Eli Rabett EcologySenseUK John C. Menzies Ned Nikolov, Ph.D. Youcantbeserious David Rice The Writer John Strok RationalClimate Gary Hall The slowly cooling Sun did not rapidly warm the Earth.
Satellite Solar irradiance. The green line is my separated linear component.

Indonesisches Bergwiesel Mark Lunn Wayne Allan Ken P. Jim D Lex Craig Thomler Dr. Brian Poe TrixX306 Marek Sas-Kulczycki Sylvain Marcoux Jim Bowers Chow for now James Abbott La Bourgeoisie BubbasPossumRanch Chris B Bacon Joseph Gatta Eli Rabett Jim Java ꤶ @[email protected] MichaelCrow nonsequiturmemes George Jefferson Roger Clague John Crowley Martin - Vax’ed and Boosted Ben Koby Bob Partridge Noel John Turner PushFourLeft Kenneth Richard 🇺🇦 Rosie TruthWillNeverDie Christopher Collins Jim Gorman Ace of Based benjamin George Harrison Joseph E Postma SortingThruDaNoiz de^mol Anderoo Josson Me myself and I Nick Schroeder Mitchell McAleer James West BarkingMadMD🇺🇸🇮🇱 James William Owens isma adino bigbarbwire.com/product-page/g…
Looks like it’s legal in Arizona (go figure).


LXX Researcher Craig Thomler KissTheTruth Jim Java ꤶ @[email protected] That Was Then This Is Now 🇺🇸 Robert Ingersol 𝔻𝕒𝕨𝕟𝕋𝕁𝟡𝟘™ 🇵🇭💖🇨🇦 Climate of Dawn I♥CO2 G0 - FUCK - YOURSELF! :) James Walker BONUS Atomsk's Sanakan Jeremy Poynton Robert Kurth Ed Bohman Grumpy Skeptic 🐭 𝓢𝓵𝓲𝓭𝓮𝓼𝓱𝓸𝔀 𝓑𝓸𝓫 𝓢𝓪𝓰𝓲𝓷𝓸𝔀𝓼𝓴𝓲 Citizen Jill American NATIONALIST! AMERICA FIRST Daniel Braude AltUSARC PAGeologist Prove the Constitution APPLIES to me Steve Goddard Matthew L. Bonnstetter Robin Hagues 🐭🌸 ✝️ 🇦🇺𝓡𝓸𝓮𝓵𝓸𝓯 𝓑𝓸𝓮𝓻 AKA Roy Boi’d 🦅 BJ Kevin Martin Karl Greg B🍻 הלל גרשוני Hillel Gershuni Dcoronata Ed Darrell 8645110320 CMH1961 Chris Martz Greg Richard Milne Brandon Olson John Palkovic BOOMER'62 Official Planet Love 🌎 Climate Realists🌞 brad schrag O.K. Buhmer Mark Imisides David Hanselman Anthony Johnson That objection is trivially easy to address by computing global temp results from a tiny fraction of stations equally distributed around the globe.
Unadjusted data from 22-30 rural stations will reliably produce results that confirm the warming reported by NOAA&NASA.
Mike Jagger AltUSARC 🇦🇺𝓡𝓸𝓮𝓵𝓸𝓯 𝓑𝓸𝓮𝓻 AKA Roy Atomsk's Sanakan Old Soldier Balance KCTaz Matthew L. Bonnstetter Donald Trump is the legitimate President Craig Thomler 𝐆𝐫𝐚𝐧𝐭 𝐅𝐚𝐫𝐪𝐮𝐡𝐚𝐫 Daniel Braude Jim Java ꤶ @[email protected] [email protected] John Charles Hamilton Mastroligulano Ransom Shawn Serbin James West Fraser MacLeod🇨🇦🇵🇸 President Weevil, Tanuki City / Graeber Crow / Climatism 🇦🇶 RJ© Jfd223 Brandon R. Gates LynDoesArtStuff Texas True Munungus caerbannog666 🇺🇸🇺🇸🏴☠️🏴☠️💉💉💉💉 Mike Jagger
Clintel.org

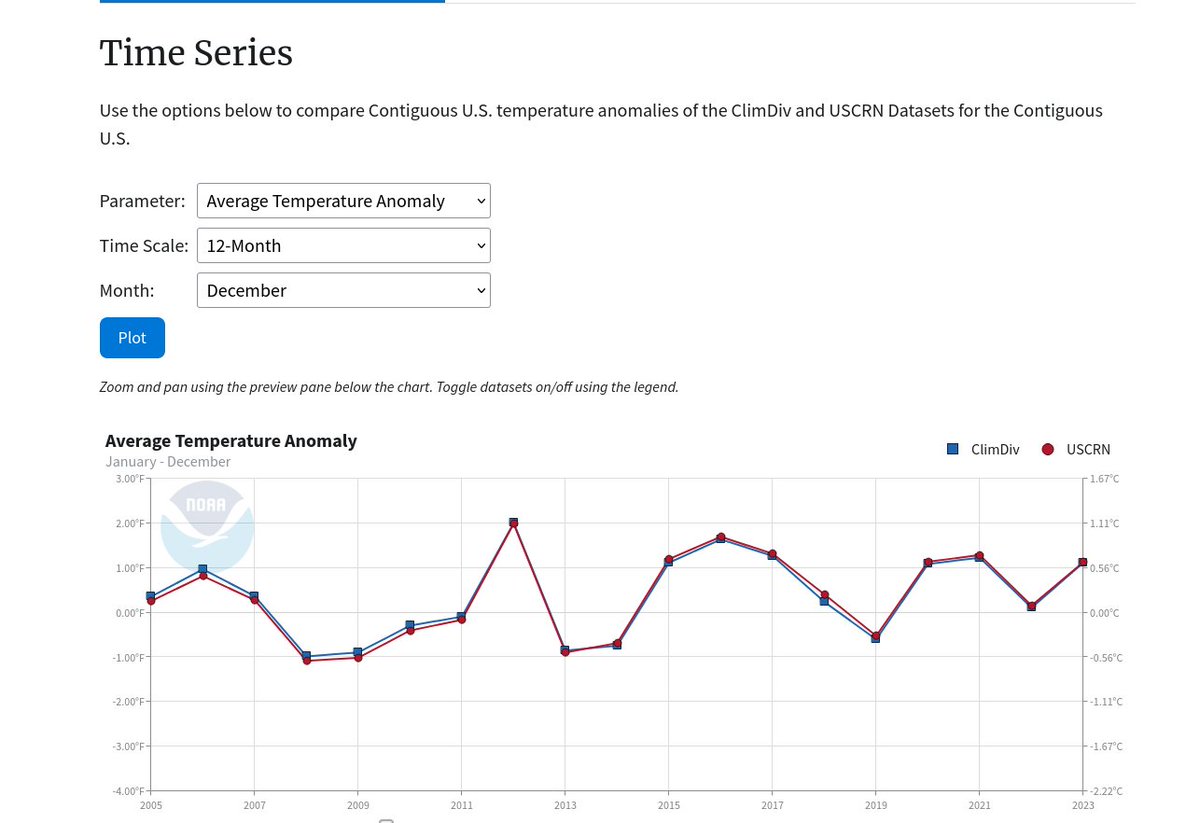
Jim Java ꤶ @[email protected] John Dodders Plots generated with ncei.noaa.gov/access/monitor… are very clearly labeled Contiguous U.S. (aka CONUS).
Clearly not an apples-vs-apples comparison with results that include Alaska stations.

ItsTheAtmosphere @[email protected] Dale Mullen Rodger L Nelson That Was Then This Is Now 🇺🇸 Martin - Vax’ed and Boosted Struik Atomsk's Sanakan Dcoronata Jim D ⓇⓔⓓⓓⓡⓐⒼⓞⓝⓕⓛⓨ19👩💋❤️👠🌹🇺🇸🇨🇦 Massi StormSignal Crispin Doyle BubbasPossumRanch Quieroserabuela Bernardo Verda 🤔 Sharon Patterson AltUSARC steven mosher #bitcoin caerbannog666 🇺🇸🇺🇸🏴☠️🏴☠️💉💉💉💉 F.B.EYE ت 🇨🇦 Andy - Cosmic 🦄 John-Galt KCTaz OVERTHROW OIL climatechangedeniers @RushhourP Phil Blackwood Bob Johnston Tim Ferguson ⚓️ Bones Z ⚓️🇺🇸 Jim Java ꤶ @[email protected] Rosamond California 💙😷 Dorothy Dimock Robin Hagues 🐭🌸 ✝️ Marcus Gibson Baltch Pancho Neptune This Hobbit Peer Review Steve Dondley anonymous OLD skull,shedding husky, old cats home Lenny Chukchi sea ice cover was decreasing a lot since 1750 and before...


𝔻𝕒𝕨𝕟𝕋𝕁𝟡𝟘™ 🇵🇭💖🇨🇦 Climate of Dawn BubbasPossumRanch Rodger L Nelson Jim Java ꤶ @[email protected] Dale Mullen Jim D Jim Gorman FactChecker76 ItsTheAtmosphere @[email protected] That Was Then This Is Now 🇺🇸 john digregorio benjamin Inside Your Mind 🧠 Sharon Patterson BONUS Jeremy Wickersheimer StormSignal steven mosher #bitcoin Boothe caerbannog666 🇺🇸🇺🇸🏴☠️🏴☠️💉💉💉💉 Mathew David Clough ㅂㄹㅁ Dcoronata No1TrumpSupporter Aanthanur - Masks work notsure 🍥 Atomsk's Sanakan tom goldman 🇱🇷 Over400ppm d@niel George Harrison Phil Blackwood Friends of Science ⓇⓔⓓⓓⓡⓐⒼⓞⓝⓕⓛⓨ19👩💋❤️👠🌹🇺🇸🇨🇦 Patrik Dan Buck Smith Gerard Martin Brampton Bernardo Verda 🤔 Alpha OmegaEnergy "The Energy Kraken" Lady Lumps OVERTHROW OIL Weather Cat 🇺🇸 Kjell Arne Høyvik KCTaz @EwonSprokler NOAA Richard Easton It’s even nicer if you add the wrong forecasts made by the SW computer people.


🇺🇦 Rosie Dan Sullivan Marcus Swann Adrian Cojanu 🇺🇦 Wowbagger Jim Java ꤶ @[email protected] Balls McGee James William Owens Mark Lunn ✝️ 🇺🇸 🇺🇦 Dave Burton Bourgeois Bolshevik 🇦🇺 rob My War on Drugs against Pseudoscience on Steroids Chris B Bacon Al White That Was Then This Is Now 🇺🇸 Martin - Vax’ed and Boosted Data Christopher Taylor Remi Brian Pittock Really_Bad_At_Names, Good at Science🦎 Christopher Collins John Crowley Lord Vetinari Eli Rabett That Was Then This Is Now 🇺🇸 Timothy J Dunkerton MrsAristotle FD2you 👀 KCTaz Dr. Sundance BONUS Giles Bointon Climatehope Definitely not Elon Musk Steve Mannix paulp123 Robert Willy820 Prof Mick Wilson Millard Fillmore White House Library Tommy Lambert Joe the Atheist Pierre L. Gosselin Peter Clack Zeke Hausfather In short, the people who had grown up or lived in that region, and had deep knowledge about the people & cultures there, knew that Junior's invasion of Iraq would turn out to be a disaster.
The ppl vocally in favor were, to a man/woman, complete ignoramuses about the region.

Jeremy Poynton KissTheTruth LXX Researcher Craig Thomler Jim Java ꤶ @[email protected] That Was Then This Is Now 🇺🇸 Robert Ingersol 𝔻𝕒𝕨𝕟𝕋𝕁𝟡𝟘™ 🇵🇭💖🇨🇦 Climate of Dawn I♥CO2 G0 - FUCK - YOURSELF! :) James Walker BONUS Atomsk's Sanakan Robert Kurth Ed Bohman Grumpy Skeptic 🐭 𝓢𝓵𝓲𝓭𝓮𝓼𝓱𝓸𝔀 𝓑𝓸𝓫 𝓢𝓪𝓰𝓲𝓷𝓸𝔀𝓼𝓴𝓲 Citizen Jill American NATIONALIST! AMERICA FIRST Daniel Braude AltUSARC PAGeologist Prove the Constitution APPLIES to me Steve Goddard Matthew L. Bonnstetter Robin Hagues 🐭🌸 ✝️ 🇦🇺𝓡𝓸𝓮𝓵𝓸𝓯 𝓑𝓸𝓮𝓻 AKA Roy Boi’d 🦅 BJ Kevin Martin Karl Greg B🍻 הלל גרשוני Hillel Gershuni Dcoronata Ed Darrell 8645110320 CMH1961 Chris Martz Greg Richard Milne Brandon Olson John Palkovic BOOMER'62 Official Planet Love 🌎 Climate Realists🌞 brad schrag O.K. Buhmer Mark Imisides David Hanselman Anthony Johnson At what calendar year does that Greenland ice core record end?

🇺🇦 Rosie Dan Sullivan Marcus Swann Adrian Cojanu 🇺🇦 Wowbagger Jim Java ꤶ @[email protected] Balls McGee James William Owens Mark Lunn ✝️ 🇺🇸 🇺🇦 Dave Burton Bourgeois Bolshevik 🇦🇺 rob My War on Drugs against Pseudoscience on Steroids Chris B Bacon Al White That Was Then This Is Now 🇺🇸 Martin - Vax’ed and Boosted Data Christopher Taylor Remi Brian Pittock Really_Bad_At_Names, Good at Science🦎 Christopher Collins John Crowley Lord Vetinari Eli Rabett That Was Then This Is Now 🇺🇸 Timothy J Dunkerton MrsAristotle FD2you 👀 KCTaz Dr. Sundance BONUS Giles Bointon Climatehope Definitely not Elon Musk Steve Mannix paulp123 Robert Willy820 Prof Mick Wilson Millard Fillmore White House Library Tommy Lambert Joe the Atheist Pierre L. Gosselin Peter Clack Zeke Hausfather I remember two co-workers who were opposed to Junior's war.
One grew up in Iraq. Pre-war in Iraq, his relatives there were prosperous middle-class Christians. Bush's folly turned them into refugees.
The other served in Afghanistan (pre-Taliban) as a Peace Corps volunteer.
