Watch this space 🌎
Inspired by the incredible Ed Hawkins #climatestripes we wanted to kick ass and make a difference as any rebel highlander would!
Fighting for the fabric of the planet, we’re in, are you?
#Unstoppable

Today is the #SummerSolstice and #ShowYourStripes day, where people all over the world are thinking about #ClimateChange .
Here is a #ClimateStripes inspired animation.
Share your own climate stripes from showyourstripes.info

Verhelderende weergave van de
#klimaatstreepjescode #climatestripes
🌍 Een mondiale gemiddelde jaartemperatuur is het gemiddelde van alle landen: dat kan onderling nogal verschillen. Maar trend is onmiskenbaar universeel! 📈
Video Berkeley Earth

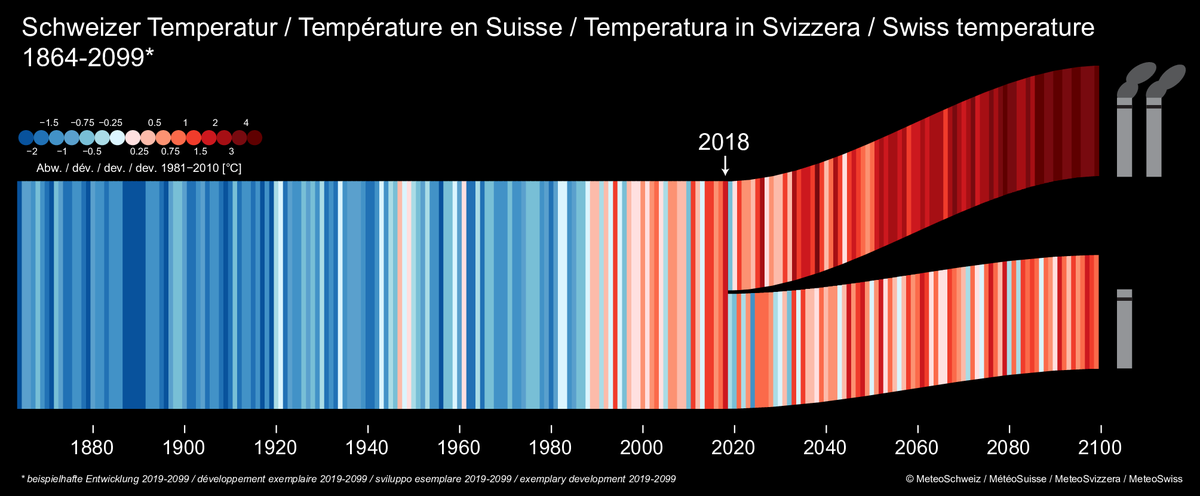
Klimastreifen #climatestripes des vergangenen und zukünftigen Schweizer Klimas. Die Erwärmung beschleunigt sich. Mit Klimaschutz sind zwei Drittel der zukünftigen Erwärmung vermeidbar. Die Weichen für das kommende Klima werden jetzt gestellt. #MeteoSchweiz
bit.ly/2mTQXWD

The MN Senate has passed the 100% Clean Energy Bill!
Proud to be a coauthor on this important step in mitigating climate change and protecting our environment. 🌎
I wore my #climatestripes (along with #GoRedForWomen ) in honor of the occasion.
#ClimateAction


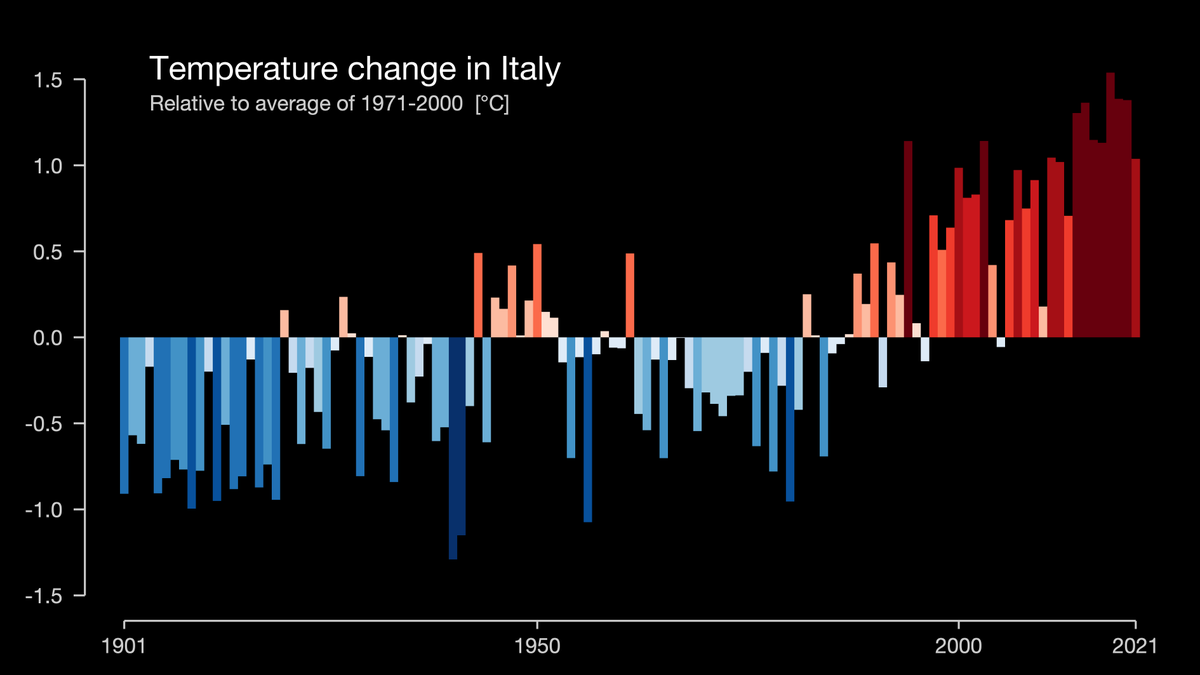
The #FIFAWorldCup 2022 starts tomorrow. How has Qatar's climate changed since since the inaugural edition of the tournament in 1930? #climatestripes
#ShowYourStripes Ed Hawkins


It’s #ShowYourStripes day - a day in which meteorologists around the world unite to highlight our changing climate, using #ClimateStripes
Here’s more on what climate stripes are, and the significance of them …

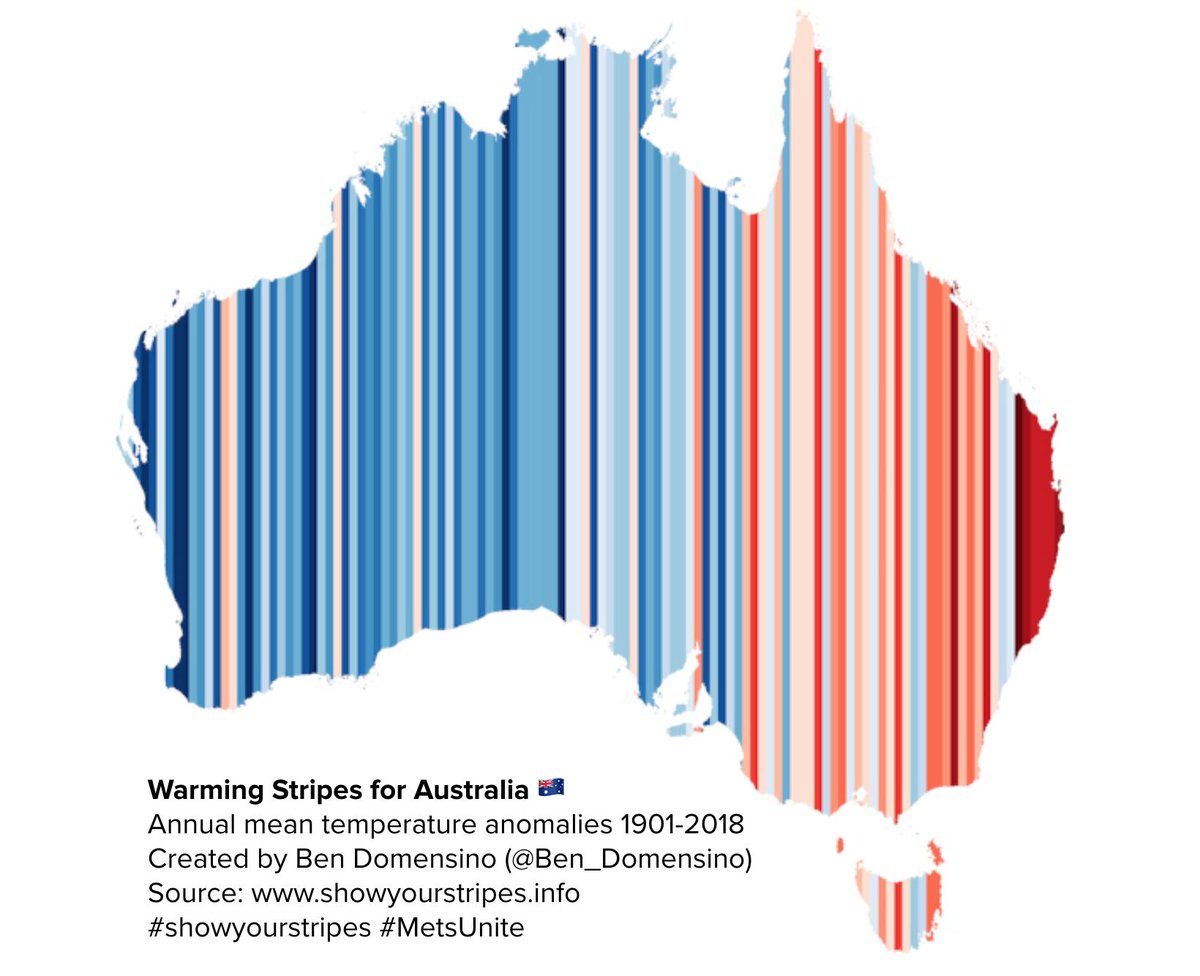
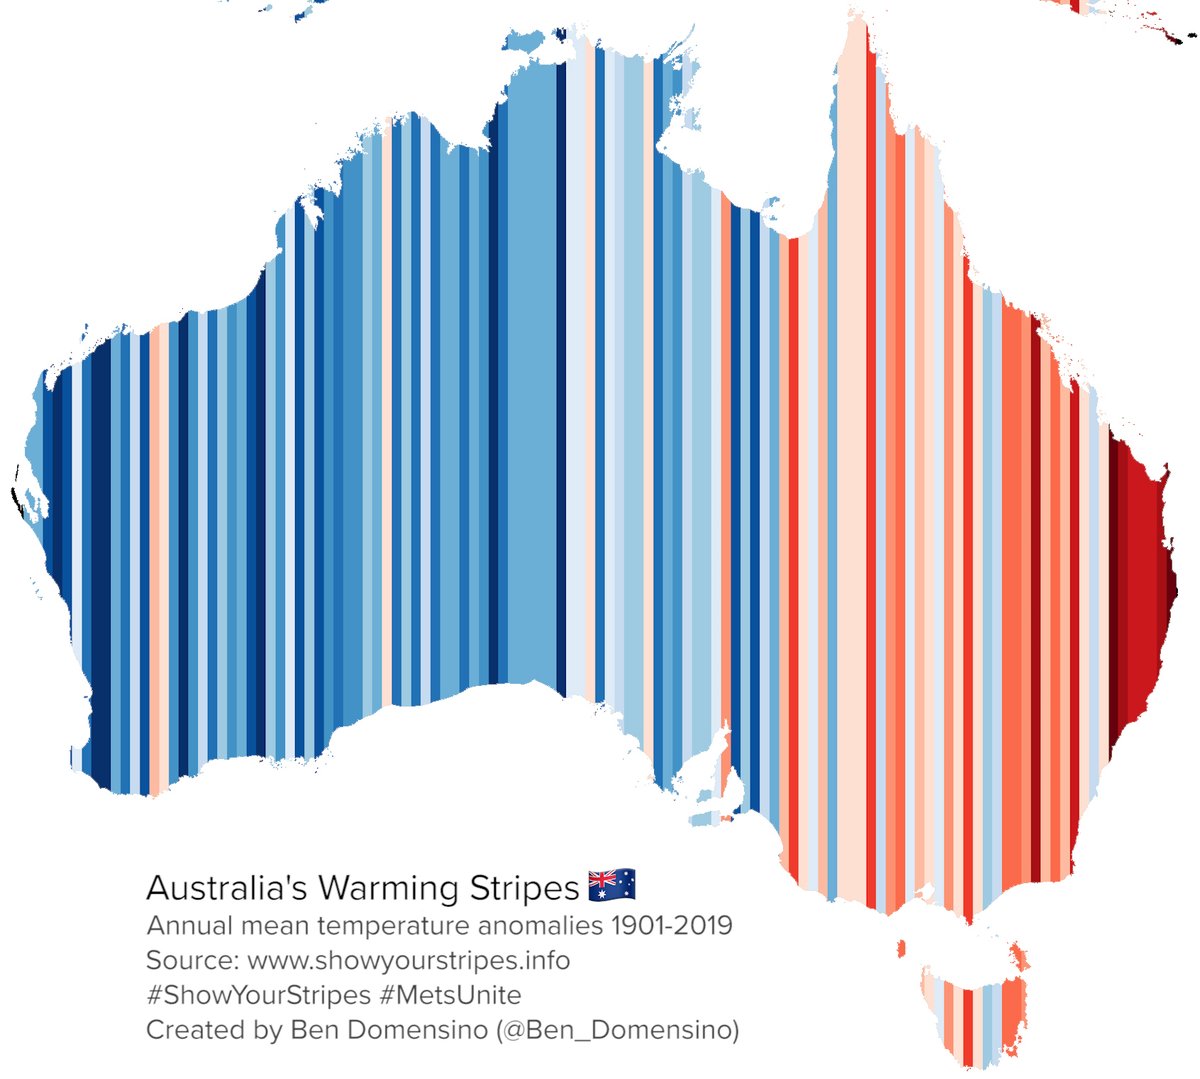
Australia's climate has warmed by just over 1°C since 1910. This map shows how our country's annual average temperature anomaly has changed over time using Ed Hawkins #climatestripes
More details and other countries at: showyourstripes.info
#MetsUnite
#showyourstripes


An oak sadly fell in #Reigate Priory Park last week. We counted rings, measured girth and height and found that in 150 years it sequestered 10 tonnes of CO2 which is now being slowly released into air and soil. It lived through a 1C temp rise..1/3 #climatestripes © Ed Hawkins


Australia has warmed by more than 1ºC during the last century and last year was our country's warmest on record. This map shows how Australia's annual mean temperature has changed since 1901 using Ed Hawkins #climatestripes
#MetsUnite
#showyourstripes

12 days late, but I finally made 11x3 #ClimateStripes for all 50 states, DC and CONUS.
Enjoy y'all
ncics.org/pub/jared/stri…
#ShowYourStripes


Today on #WorldEnviornmentDay I had the opportunity to present the Copernicus ECMWF State of the Climate report #ClimateAction #ClimateStripes

The amazing Ed Hawkins is taking his #ClimateStripes global with the launch of ShowYourStripes.info a site with simple graphics showing the history #ClimateChange in many countries and US states.
Data from Berkeley Earth, NOAA, UK Met Office, and others.
#ShowYourStripes

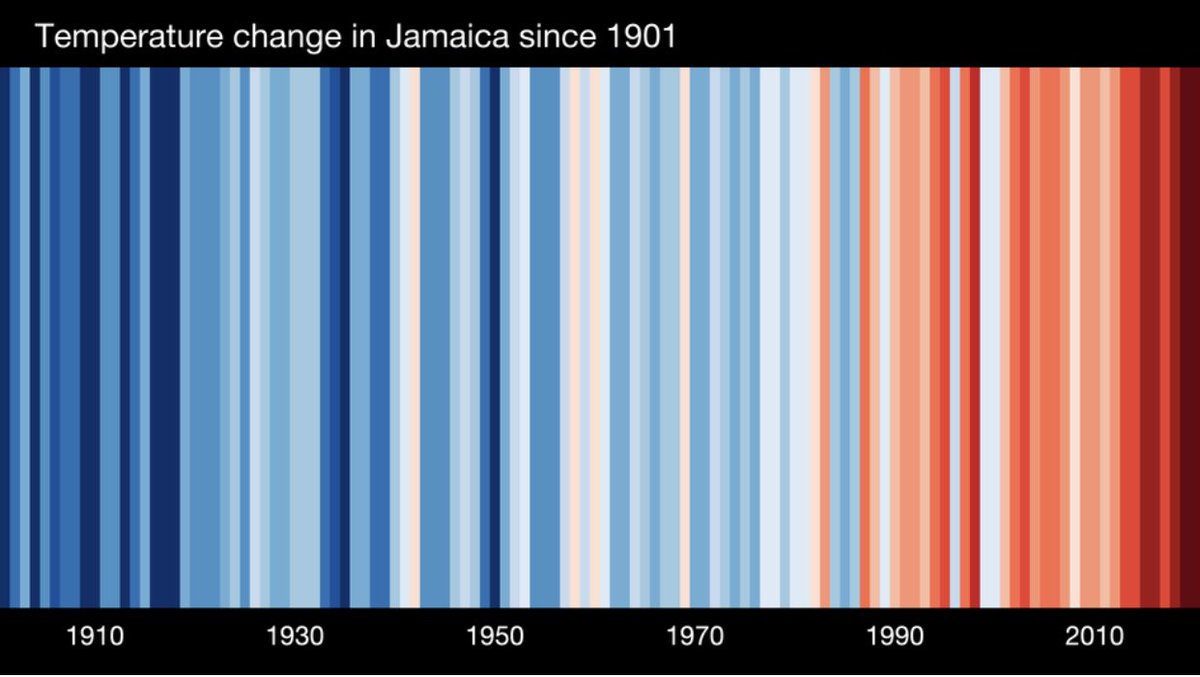
This is Jamaica’s “climate stripes” from 1900-2020. In essence it’s a relative heat map. Much to do, not a lot of time to do it.
#ClimateStripes

#ClimateStripes -kaulahuivi tuli valmiiksi! Kaulahuivi kuvaa keskilämpötilaa viimeisen 170-vuoden ajalta. Näyttää tosi kivalta, mutta lankojen päättely oli hirveetä kun väri vaihtu niin usein.
Arvaattekos muuten kumpi pääty huivista on 1850-luku ja kumpi 2010-luku?


#ClimateStripes für Stuttgart:
Die Visualisierung der jährlichen Durchschnittstemperatur zeigt so simpel wie schockierend die Temperaturentwicklung der letzten Jahre. Bisher gibt es Visualisierungen weltweit oder deutschlandweit, wir ergänzen eine Grafik für die Region Stuttgart:
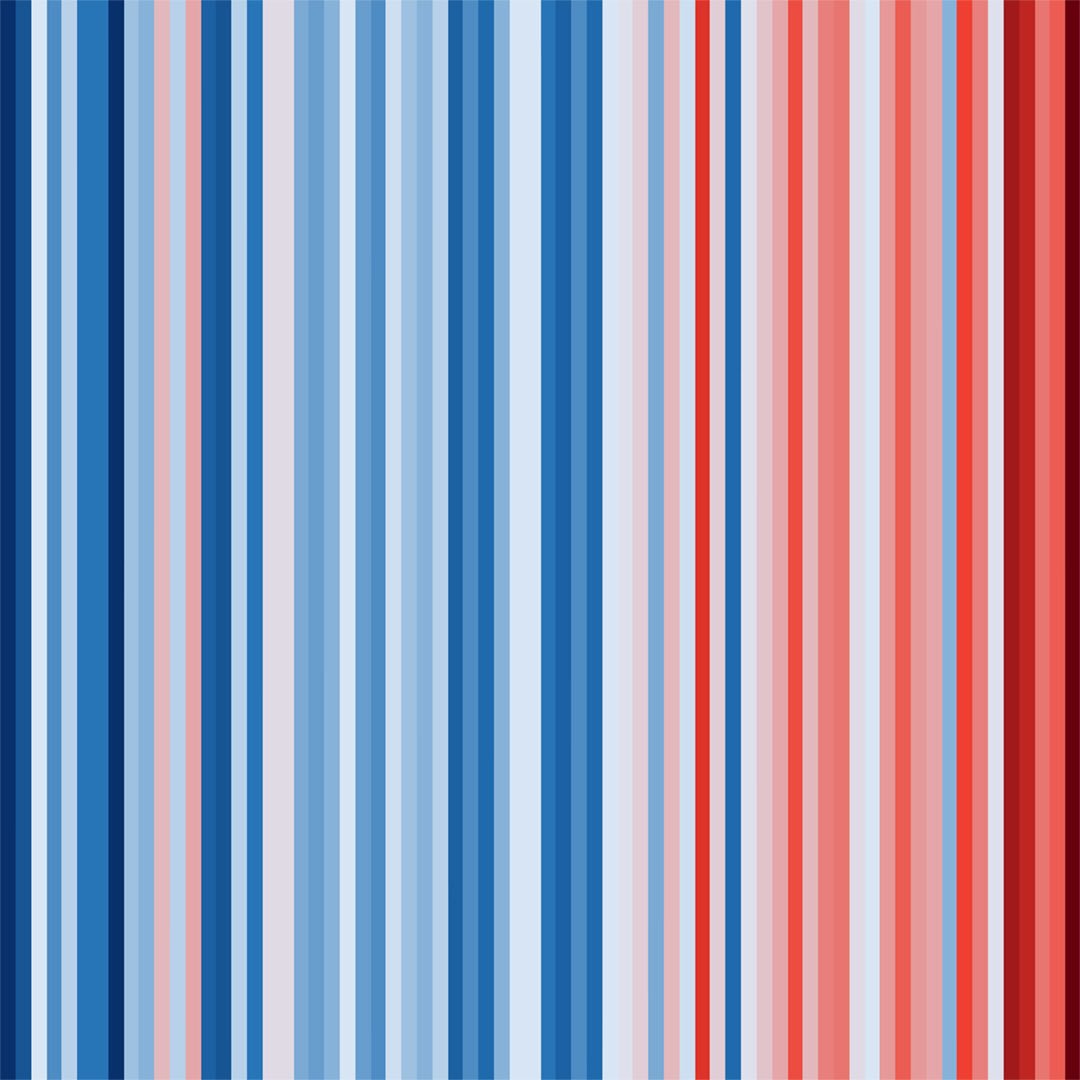

📈A huge projection of Ed Hawkins #climateStripes on the white cliffs of Dover to show how the UK is warming
A reminder of how rapidly we are warming for #ShowYourStripes day

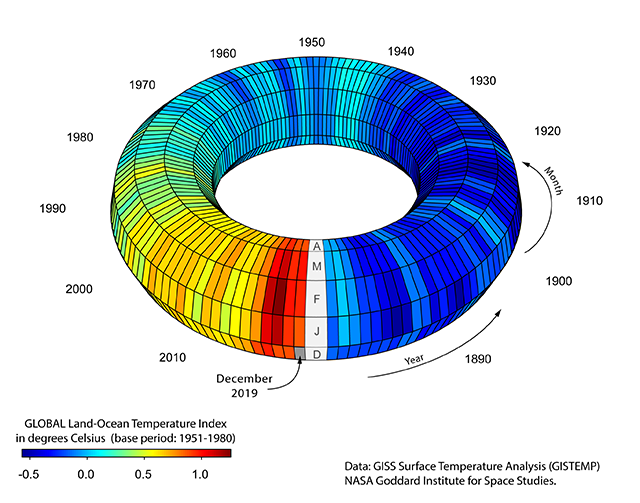
Inspired by Ed Hawkins #climatestripes I made a 3D climate donut 🍩😱
#ClimateChange #ShowYourStripes #ShowYourTorus #rstats #scicomm
