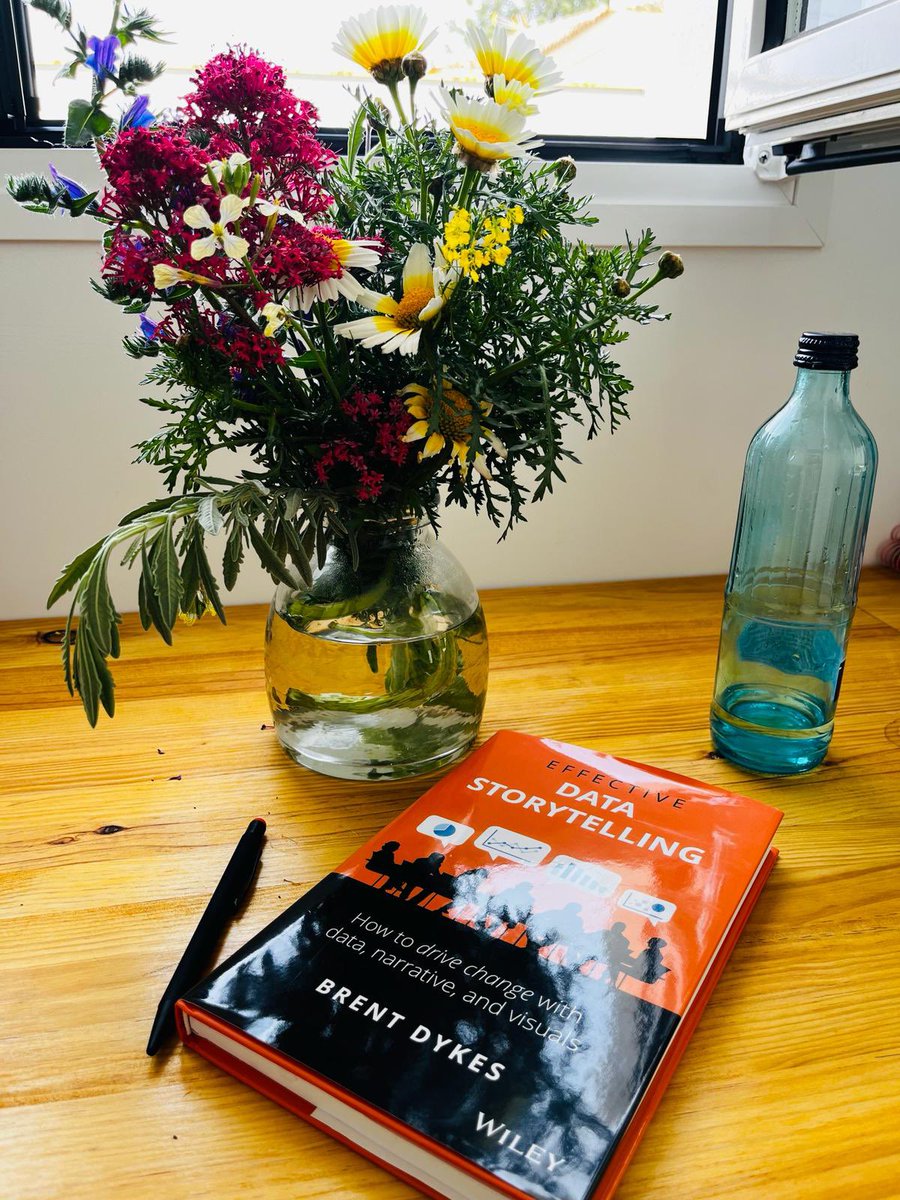
Surfed Online and saw a dashboard and i decided to replicate.
What’s your rating🔥
PS: This visualization and inspiration was gotten from (The Developer)
#DataVisualization #MicrosoftPowerBI #InteractiveDashboard #DataAnalysis #IpajaLagos #Nigeria #DataStorytelling .

I might just start teaching Data Analysis to the World🫢 I can’t be this stingy
This visualisation was done with dataset gotten from Kaggle
#DataVisualization #MicrosoftPowerBI #InteractiveDashboard #DataAnalysis #IpajaLagos #Nigeria #DataStorytelling #DataInsights .

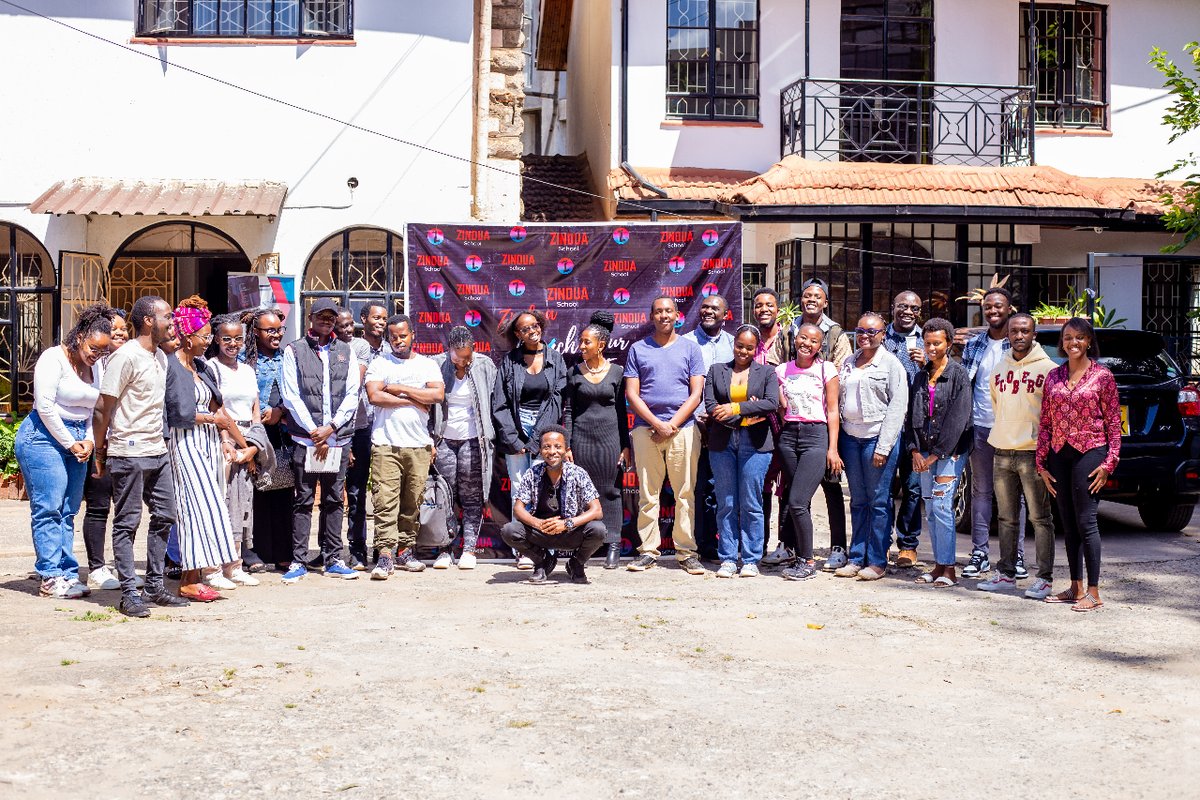
#upskillintech I'm super excited to start learning #DataAnalysis through the .Zindua School & YoungTechiez #30daychallenge ! This boot camp will equip me with the fundamentals of #Tableau , #SQL & #DataStoryTelling
Data Storytelling morioh.com/a/6d43d951a90f…
#data #data storytelling #data analytics #data science #machinelearning #deeplearning #ai #artificialintelligence #programming #developer #morioh #softwaredeveloper #computerscience #calculus #linearalgebra #python

Zapraszam do współpracy 🙂
Oprócz szkolenia z #DataStorytelling , które trwa 4h, realizuję również skrócone wystąpienie z tego tematu (30 min do max 1 h), które prezentuję podczas większych konferencji.


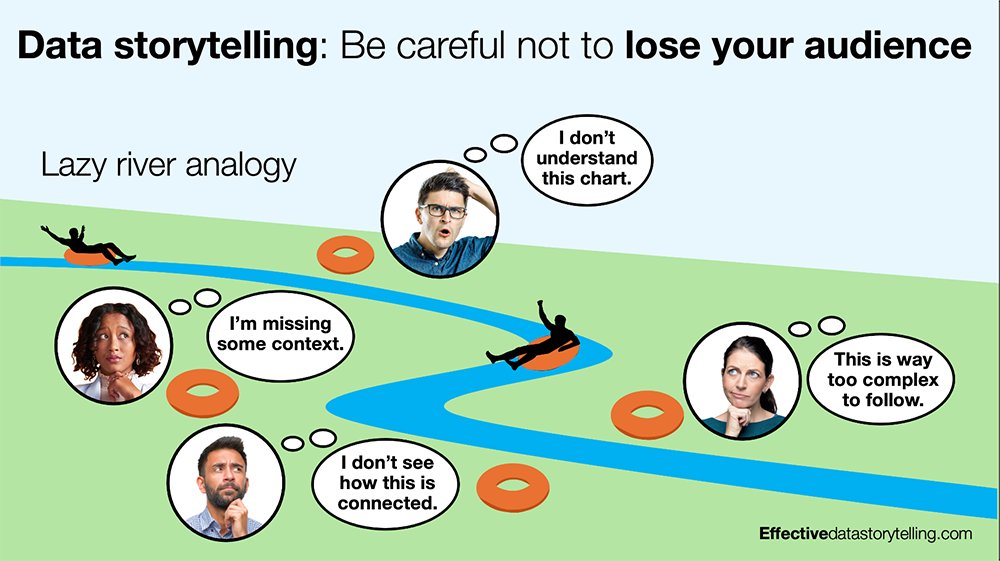
Be careful not to lose your audience when telling a data story. Inadvertently, you can cause the audience to stop following your narrative in many ways. #datastorytelling
linkedin.com/posts/brentdyk…


To był intensywny, ale bardzo ciekawy tydzień 💪
Katowice - moderacja panelu o #finansepubliczne na #EEC2024
Gdynia - wystąpienie z #datastorytelling na Forum Przedsiębiorstw
Katowice - udział w panelu o #edukacjaekonomiczna na #EEC2024
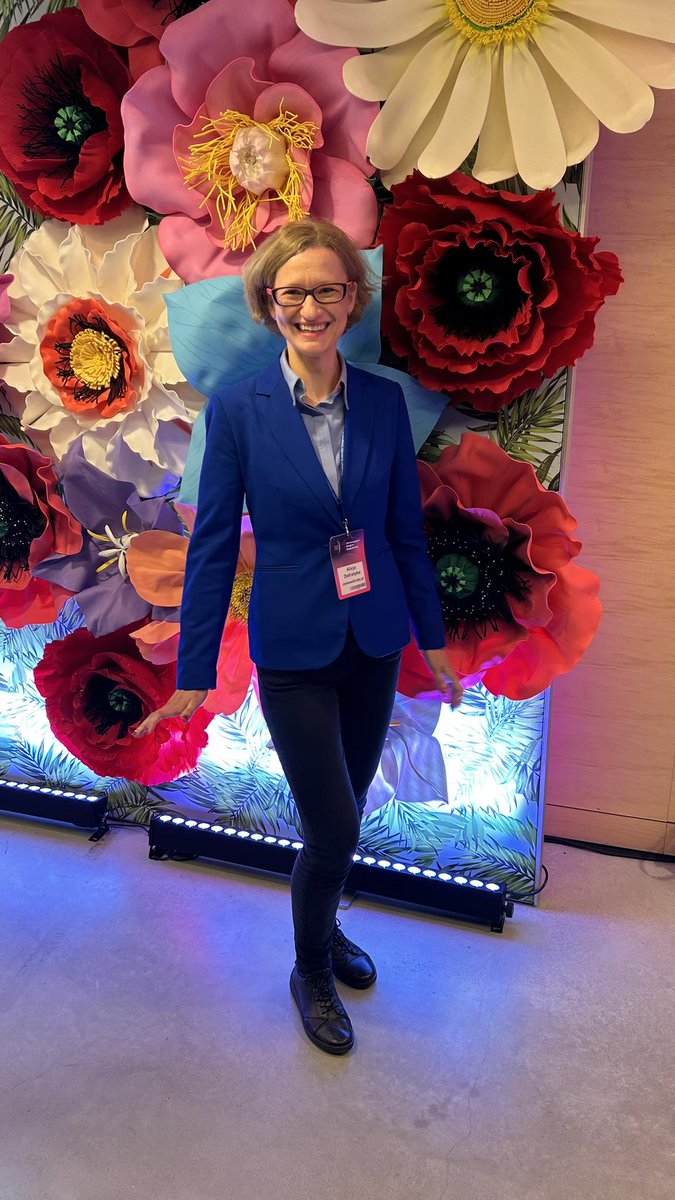

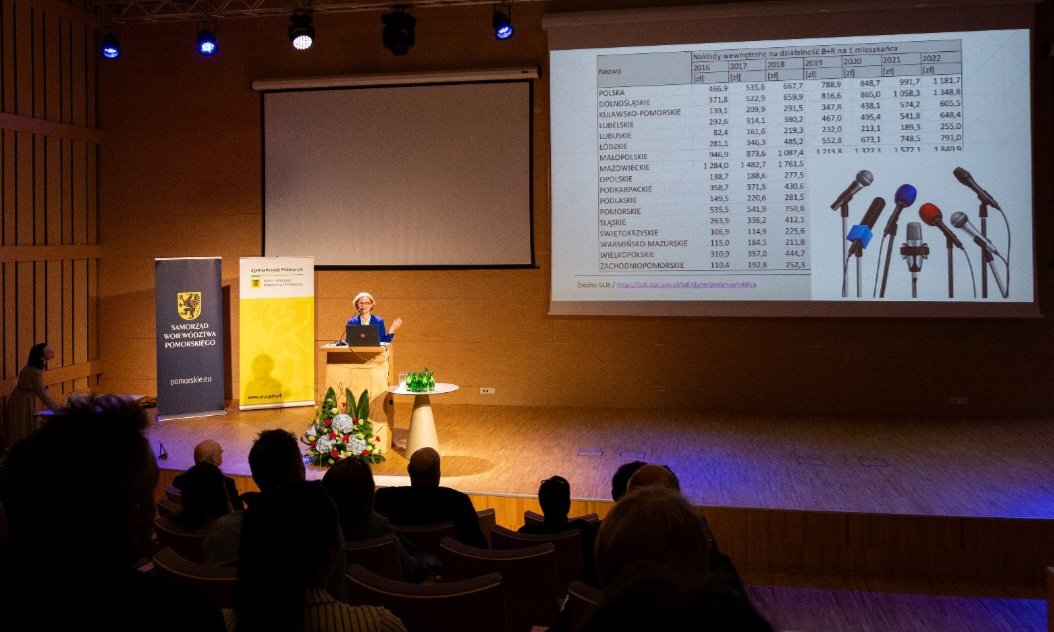
Dzisiaj miałam przyjemność wystąpić na #ForumPrzedsiębiorstw w Gdyni z tematem „ #DataStorytelling , czyli wykorzystanie liczb i danych w biznesie”.
Wydarzenie zostało zorganizowane przez Agencję Rozwoju Pomorza.

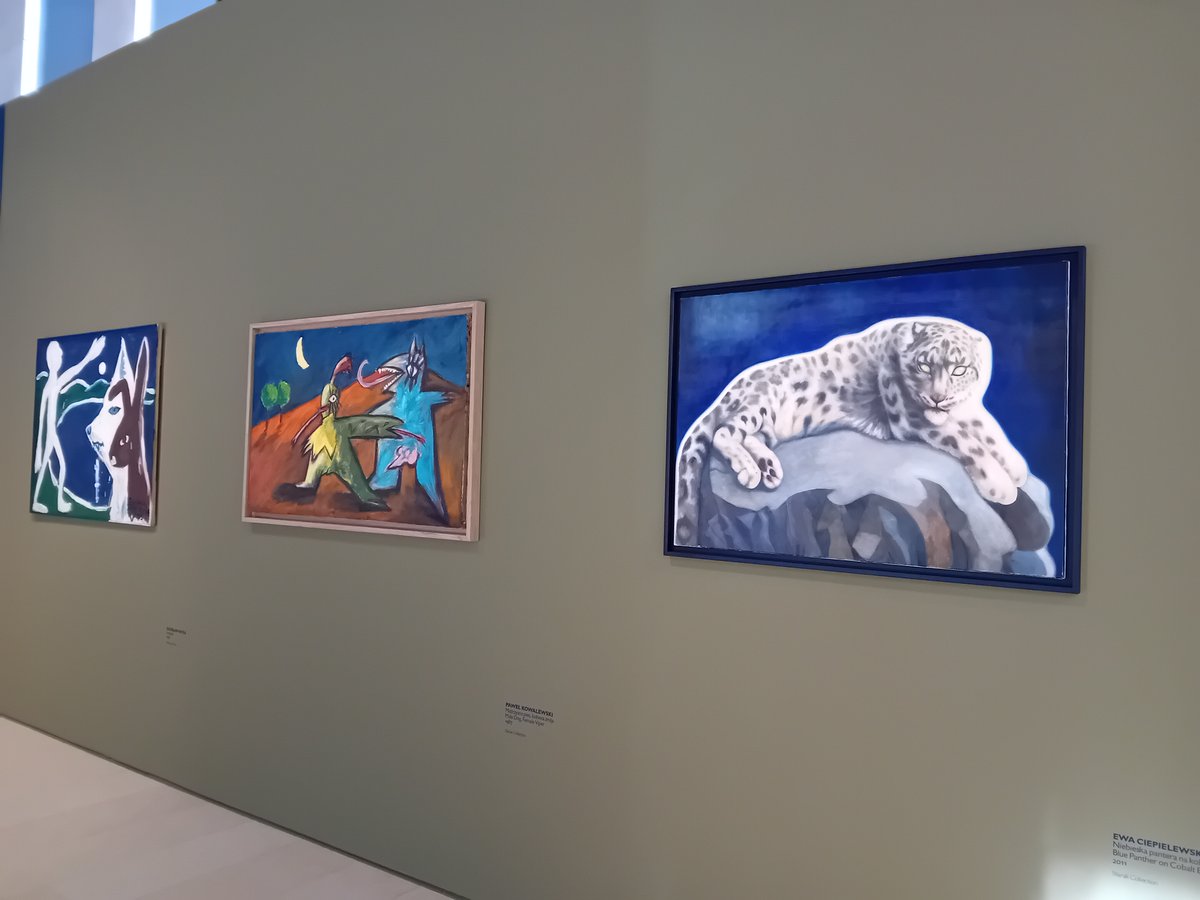
W tym tygodniu prowadziłam szkolenie dla #Polpharma z #DataStorytelling
Nie wiem, czy wiecie, ale w siedzibie Polpharmy znajduje się kolekcja dzieł sztuki, więc idąc tam, poczujecie się jak w przepięknej galerii.
Szkolenie w takich warunkach i dla takiego zespołu, to czysta

📊 Excited to announce our Data Storytelling course! 🚀 In today's data-driven world, effective communication of insights is crucial.
Learn more: computertrainingwales.co.uk/courses/ai-cou…
Join us to master the art of transforming raw data into compelling narratives. #DataStorytelling

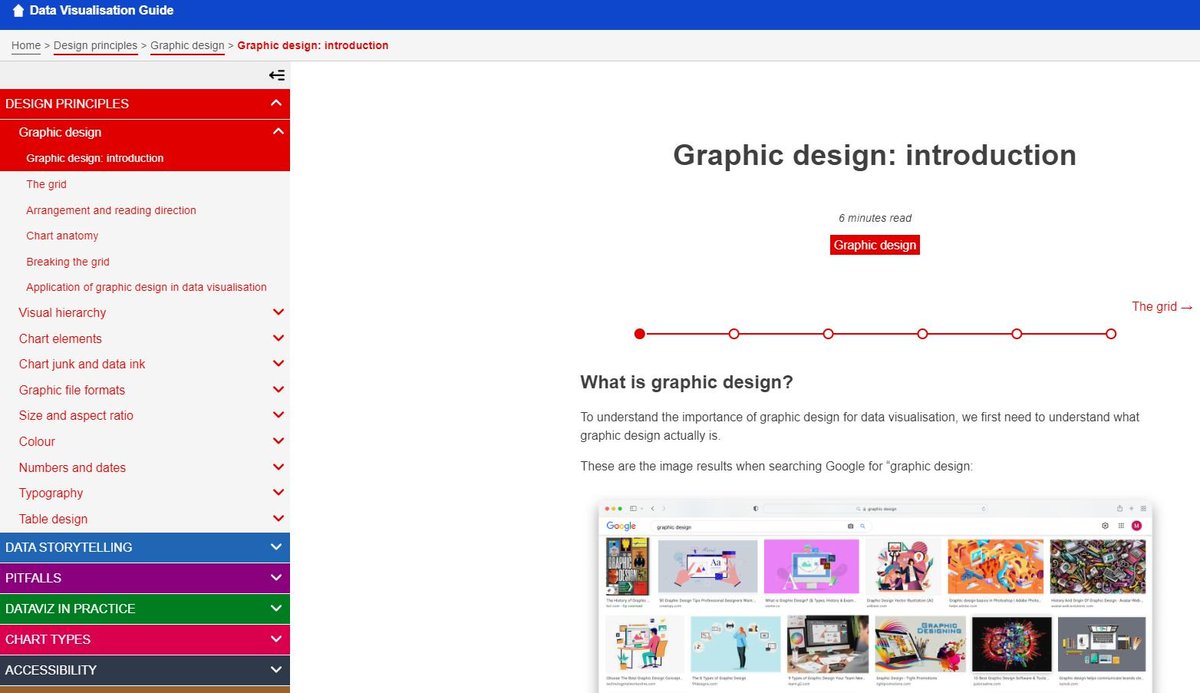
Guía europea de visualización de datos con recursos muy top 💪
🔗 lnkd.in/ddnRP5pX
De las más completas que puedo recomendar 😍
#dataviz #datavisualization #datastorytelling

In #datastorytelling , we need to draw a distinction between visualizing 'the data' and visualizing 'the message.'
linkedin.com/posts/brentdyk…


#Data Storytelling in #PowerPoint and #PowerBI just got a whole lot cooler!
Want to see how you can keep your dashboard LIVE and AUTOMATICALLY refreshing?
Want to see how you can use AI to enhance the narrative around your #Data in your decks?
Check out my latest video that

We can all use a little extra 'wow' factor in our dashboards.
This video teaches you how to create impactful combo charts!
#DataStorytelling #VisualCommunication #Charts #Dashboard #Datascience #Businessintelligence

Big thanks to all who joined our Data Storytelling Workshop! 🙌 Special shoutout to Gerald Okioma & Winfry Nyarangi for their valuable insights. Stay tuned for more enriching events! #DataStorytelling #ProfessionalDevelopment #ZinduaSchool #ZinduaInTech

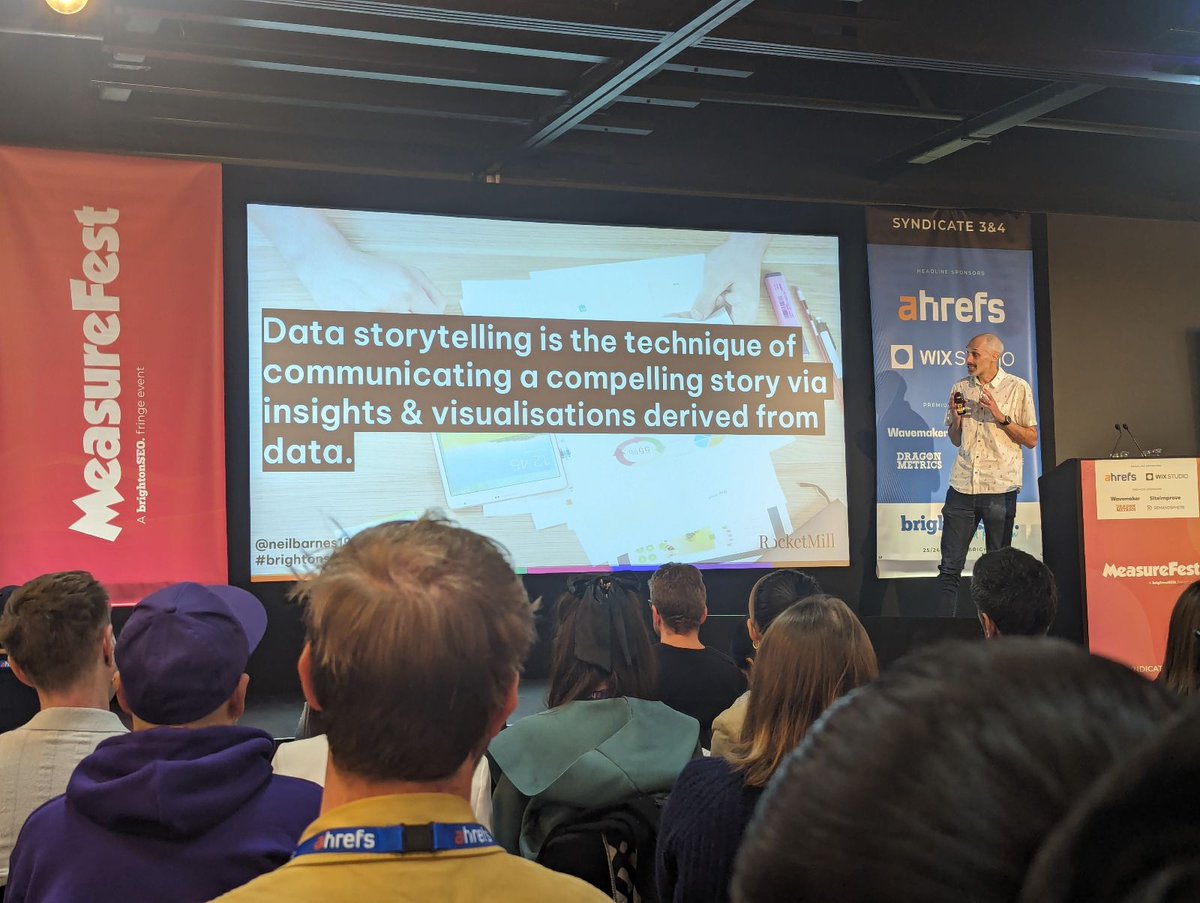
Another brilliant day at #brightonSEO with our Head of Analytics, Neil Barnes, on stage highlighting the importance of datastorytelling to drive growth.
Read more about it in his blog here: bit.ly/4bgRwg9


Discover how #Microsoft crafted the perfect recipe for successful report creation with Zebra BI. This infographic illustrates the seven pivotal steps to transform their #datastorytelling .
🔗 Read the full story here (video also available): bit.ly/48MJ32E

