
💡 Are you interested in learning more about Roveel or updating your account knowledge? Stay tuned for our upcoming video tutorials starting Wednesday!
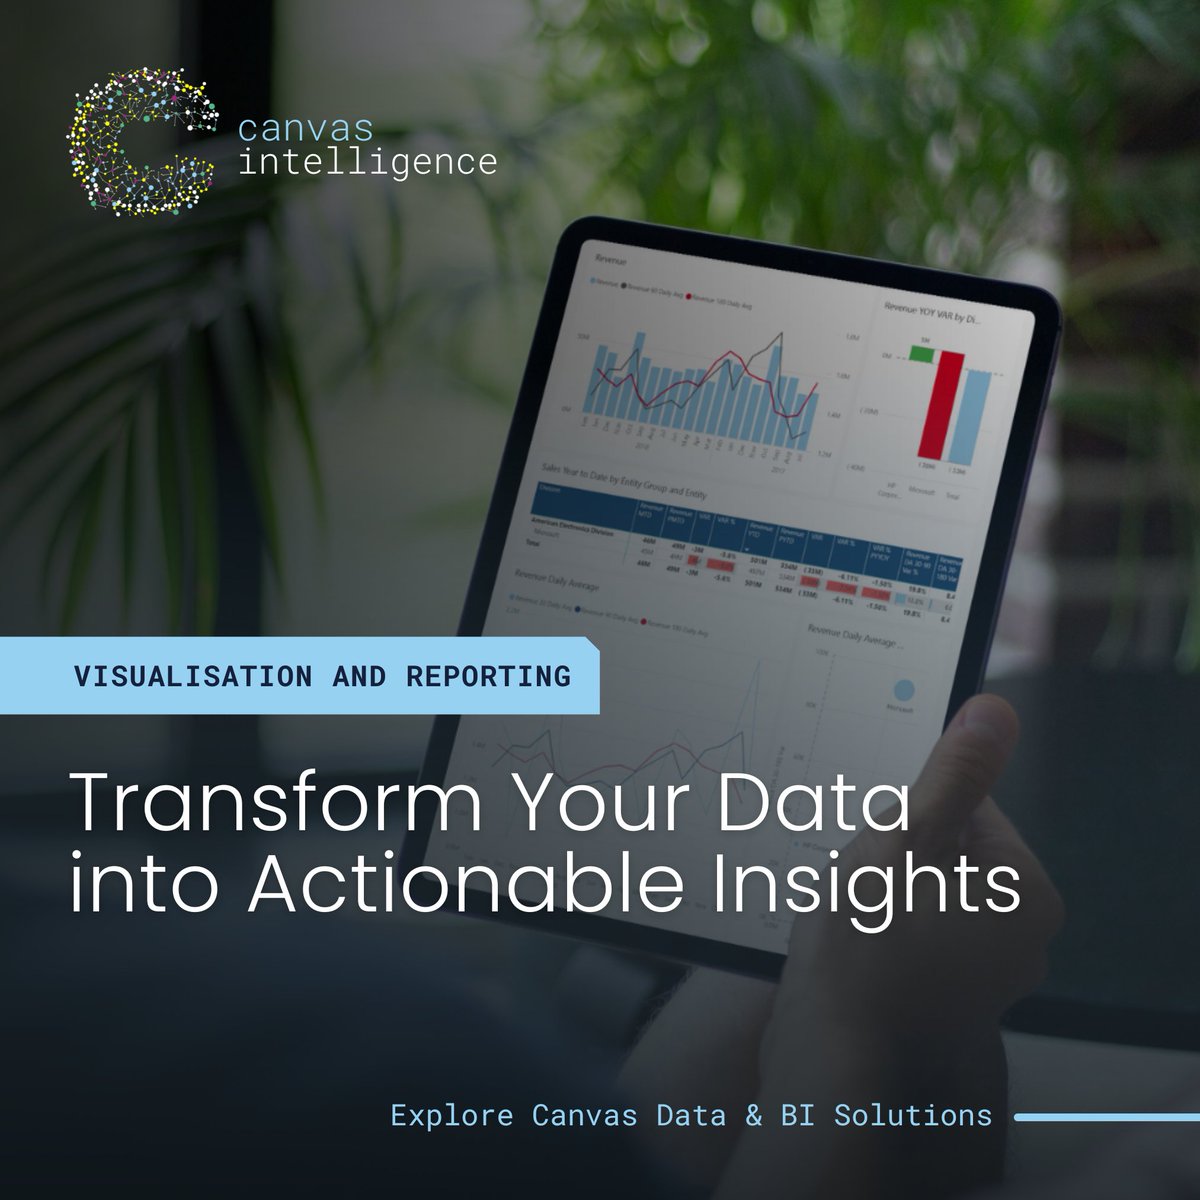
Transform your Sage or Xero data into dynamic, vibrant dashboards and reports in minutes.
#DataVisualisation #BusinessInsights

📢 𝗟𝗼𝗼𝗸𝗲𝗿: 𝗬𝗼𝘂𝗿 𝗨𝗹𝘁𝗶𝗺𝗮𝘁𝗲 𝗚𝘂𝗶𝗱𝗲 𝘁𝗼 𝗗𝗮𝘁𝗮 𝗠𝗮𝘀𝘁𝗲𝗿𝘆
✍️ Click the link below ⬇️ to discover more!!
👉 igmguru.com/blog/what-is-l…
#dataanalysis #looker #businessintelligence #bigdata #datavisualisation #dataanalytics #igmguru #googlelookerstudio

Our visualisations and reporting services are crafted to turn the complex language of data into compelling visual narratives that propel your business forward.
Learn more: bit.ly/3Vs4wuC
#CanvasIntelligence #DataVisualisation #Reporting #DataStorytelling

Test Bank - Business Analytics-Applied Modelling & Prediction 1E by James Abdey
#Modelling #Prediction #DecisionMaking #Uncertainty #DescriptiveStatistics #DataVisualisation #Probability #DecisionTree #GameTheory #Sampling #OpinionResearch #Hypothesis
issuu.com/kriswilliams27…


How do we use maps & #dataVisualisation to #BeatNTDs ? SchistoTrack helps monitor epidemiological surveys by connecting geographical information systems in real time, used for communicating risk, community engagement, mapping the shoreline & building capacity.
#ISNTDFestival


Power Query, Data Visualization Power BI, DAX, Power Automate.
Call: +91-8750676667
Visit: advancedexcel.net
#PowerBi #PowerQuery #PowerExcel #PowerBi CorporateTraining #DataVisualisation #DataAnalytics #DataAnalysis #DAX #PowerAutomate #MSExcel #Excel #PowerTool

Utilisez la mise en forme conditionnelle dans Google Sheets pour faire SAUTER les nombres importants de la page !
#googlesheetstips
#datavisualisation


#CaVientDeSortir | Découvrez la nouvelle #datavisualisation qui recense les données régionales, départementales et communales sur les demandeurs d'emploi inscrits à France Travail. Retouvez la #dataviz sur le site de la #Dares ⤵
dares.travail-emploi.gouv.fr/dossier/les-de…


🔴Live Stream 🔴
𝗟𝗶𝘃𝗲 𝗶𝗻 𝟳 𝗵𝗼𝘂𝗿𝘀!
Join me and Kevin Flerlage for an informal chat about datavis, Power BI, Tableau, and other random topics that come up along the way.
#PowerBI #Datavisualisation #Tableau
youtube.com/watch?v=LSjSIP…

Want to know how #DataVisualisation allows you to see how successful your event is?
It helps to measure and present:
👉🏻 #AudienceEngagement
👉🏻 Content quality
👉🏻 Feedback collection
👉🏻 Return on investment
Read into this here: bit.ly/4arRZf3

Considering an investment in business intelligence tools?
Categories to explore:
#Data Visualisation
#Reporting
#Dashboarding
#Data Integration
#Self -Service Analytics
#Predictive Analytics
#Data Mining
#Governance
Need in-depth guidance on picking your tech stack? DM us


「消滅可能性」があるのは744自治体 地図で見る全国1729自治体の持続可能性 sankei.com/article/202404… 産経ニュース #DataVisualization #DataVisualisation #DataScience #Econometrics #Research #SDGs #SustainableDevelopment #SustainableDevelopmentGoals

What is #DataVisualisation & how can we use #HealthData for #PublicHealth ? Dr Angelica Garcia, Department of Health Philippines takes us beyond numbers at the #ISNTDFestival session on the science and art of analytical storytelling through data visualization. #BeatNTDs


Uncover the mysteries behind data visualisation & discover how to engage others with your research & tell compelling visual stories, starting with this #UniLivImpact24 blog by Vivomotion: liverpool.ac.uk/researcher/blo…
#publicengagement #datavisualisation #researchcommunication
