MarketCharts.com
@MarketCharts
Charts, backtesting, scanning and alerts, including breadth indicators for $SPX / $SPY, $MID / $MDY, $SML / $SLY, $NDX / $QQQ, $RUT / $IWM, ETFs and more.
ID:24247232
https://www.MarketCharts.com/ 13-03-2009 20:31:17
17,8K Tweets
5,4K Followers
314 Following

ICYMI: Weekly ChartStorm blog post chartstorm.info/p/weekly-s-and…
Thanks + follow reco to chart sources
MarketCharts.com
Andrew Sarna
Topdown Charts
Kakashii
New Low Observer
The Idea Farm
Ramit Sethi
Sam Ro 📈


ICYMI: Weekly ChartStorm blog post chartstorm.info/p/weekly-s-and…
Thanks + follow reco to chart sources
MarketCharts.com
Topdown Charts
Shane C. Murphy
The Chart Report
Michael A. Arouet
Ian Harnett
Andrew Sarna

ICYMI: Weekly ChartStorm blog post chartstorm.info/p/weekly-s-and…
Thanks + follow reco to chart sources
Topdown Charts
MarketCharts.com
Liz Ann Sonders
Sam Ro 📈
Michael A. Arouet
Tom McClellan
Ian Harnett
@allocator_asset
Jason Goepfert
Meb Faber
Ryan Telford


ICYMI: Weekly ChartStorm blog post chartstorm.info/p/weekly-s-and…
Thanks + follow reco to chart sources
Topdown Charts
MarketCharts.com
Gina Martin Adams
Daily Chartbook
Duncan Lamont
Bob Elliott
Meb Faber
Barchart
Julian Jessop FRSA


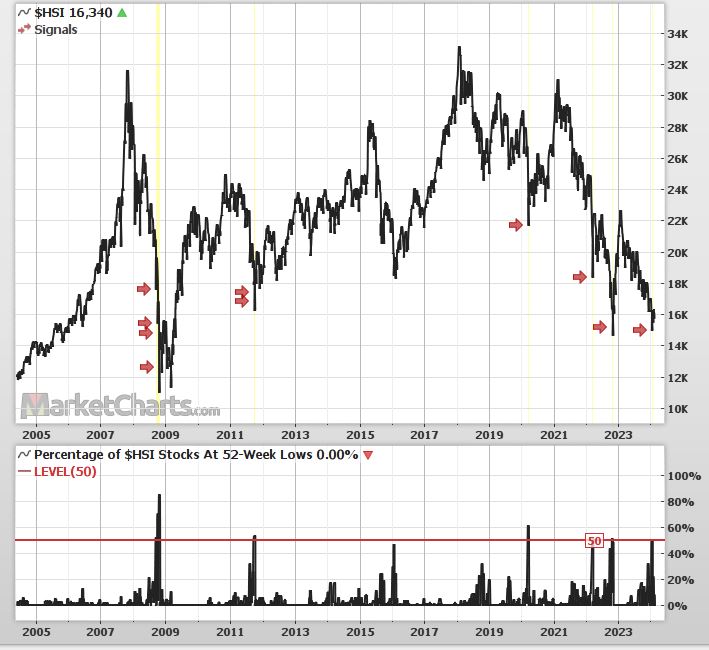
$HSI $KWEB
Near the end of January, over 50% of the 82 stocks in the Hang Seng Index (Hong Kong) hit a 52-week low.
N= 9 past 20 years
Avg 1-yr return later = 31%
Avg 1-yr drawdown = 15% (hit on day 24 on avg)
Brendan Ahern
Marcel Münch 🇨🇳📉📈
Brian Tycangco 鄭彥渊

ICYMI: Weekly ChartStorm blog post chartstorm.info/p/weekly-s-and…
Thanks + follow reco to chart sources
Topdown Charts
MarketCharts.com
Maverick Equity Research
Daily Chartbook
Cameron Dawson
Dean Christians, CMT
Jesse Felder
Snippet Finance

Weekly S&P500 ChartStorm blog post chartstorm.info/p/weekly-s-and…
Thanks + follow reco to chart sources:
MarketCharts.com
StockCharts.com
Daily Chartbook
Lance Roberts
Barchart
Ryan Detrick, CMT
Dario Perkins
Mike Zaccardi, CFA, CMT 🍖
Evan
Topdown Charts


ICYMI: Weekly S&P500 ChartStorm blog post chartstorm.info/p/weekly-s-and…
Thanks + follow reco to chart sources
MarketCharts.com
Steven Strazza
Martin Pelletier
Austin Harrison, CFA, CMT
ISABELNET
Gunjan Banerji
Kris Sidial🇺🇸
Daily Chartbook
Otavio (Tavi) Costa
Topdown Charts

Here is where I see unique opportunity in the market, and here is where I see opportunity in developing ourselves as traders: traderfeed.blogspot.com/2023/12/where-… Quantifiable Edges Barchart MarketCharts.com StockCharts.com


ICYMI: Weekly S&P500 ChartStorm blog post chartstorm.info/p/weekly-s-and…
Thanks + follow reco to chart sources:
Topdown Charts
MarketCharts.com
Macro “KING LEEROY” Tactical 👑
The Market Ear
Market Sentiment
The Kobeissi Letter
Jeff Weniger
Absolute Strategy Research
chartr 📊
Jurrien Timmer
Jamie Catherwood

